Algorithms
MultivariateOutlierDetection Anomaly Local
MultivariateOutlierDetection accepts a multivariate dataset. The algorithm receives multiple fields as input, then runs StandardScaler on the multivariate dataset to scale the dataset. Then PCA runs on the scaled dataset, deriving the fi…
MultivariateOutlierDetection accepts a multivariate dataset. The algorithm receives multiple fields as input, then runs StandardScaler on the multivariate dataset to scale the dataset. Then PCA runs on the scaled dataset, deriving the first principle component (PC_1). Finally the algorithm runs DensityFunction on the single component (PC_1) and returns outliers.
Parameters
The following is a selection of parameters for MultivariateOutlierDetection. The full parameters described in the DensityFunction algorithm all apply to MultivariateOutlierDetection.
-
The
partial_fitparameter controls whether an existing model should be incrementally updated on not. This allows you to update an existing model using only new data without having to retrain it on the full training data set.- The
partial_fitparameter default is False. - If
partial_fitis not specified, the model specified is created and replaces the pre-trained model if one exists.
- The
-
Using
partial_fit=Trueon an existing model ignores the newly supplied parameters. The parameters supplied at model creation are used instead. -
Use the
exclude_distparameter to exclude a minimum of 1 and a maximum of 3 of the available dist parameter values (norm, expon, gaussian_kde, beta).- The
exclude_distparameter is only available when the dist parameter isauto. - DensityFunction will run using any non-excluded dist parameter values.
- Use a comma to note multiple excluded dist parameter values. For example,
exclude_dist="beta,expon" - Attempts to use the
exclude_distparameter on more than 3 dist parameter values, or on a dist parameter other thanautowill result in an error message.
- The
-
The
sampleparameter can be used duringfitorapplystages. -
The
sampleparameter default is False. -
If the
sampleparameter is set to True during thefitstage, the size of the samples will be equal to the training dataset. -
If the
sampleparameter is set to True during theapplystage, the size of the samples will be equal to the testing dataset. -
If the
sampleparameter is set to True:- Samples are taken from the fitted density function.
- Results output in a new column called
SampledValue. - Sampled values only come from the inlier region of the distribution.
-
The
full_sampleparameter can be used duringfitorapplystages. -
The
full_sampleparameter default is False. -
If the
full_sampleparameter is set to True during the fit stage, the size of the samples will be equal to the training dataset. -
If the
full_sampleparameter is set to True during the apply stage, the size of the samples will be equal to the testing dataset. -
If the
full_sampleparameter is set to True:- Samples are taken from the fitted density function.
- Results output in a new column called
FullSampledValue. - Sampled values come from the whole distribution (both inlier and outlier regions).
-
Use the
summarycommand to inspect the model.- The values reported for the mean and standard deviation are either the statistics of the fitted distribution, or of the data, depending on the type of the distribution.
- In the case of parametric distributions (Normal, Beta, and Exponential) the mean and standard deviation are calculated from the fitted distribution. When the parametric distribution is not a good fit for the data, the reported mean and std might not be close to that of data.
- In the case of non-parametric distributions (Gaussian KDE) the mean and standard deviation are calculated from the data passed in during
fit.
-
Version 4.4.0 and higher of the toolkit support min and max values in
summary.- The
minvalue is the minimum value of the dataset on which the density function is fitted. - The
maxvalue is the maximum value of the dataset on which the density function is fitted.
- The
-
The output for
BoundaryRangesis the boundary ranges of outliers on the density function which are set according to the values of thethresholdparameter. -
Each boundary region has three values: boundary opening point, boundary closing point, and percentage of boundary region.
-
The boundary region syntax follows the convention of a multi-value field where each boundary region appears in a new line.
-
When multiple thresholds are provided, Boundary Ranges for each threshold appears in a different column separated with the suffix of
_th=and the threshold value. -
In cases of a single boundary region, the value for the percentage of boundary region is equal to the
thresholdparameter value. -
In some distributions (for example Gaussian KDE), the sum of outlier areas might not add up to the exact value of
thresholdparameter value, but will be a close approximation. -
BoundaryRangesis calculated as an approximation and will be empty in the following two cases:- Where the density function has a sharp peak from low standard deviation.
- When there are a low number of data points.
-
Data points that are exactly at the boundary opening or closing point are assigned as inliers. An opening or closing point is determined by the density function in use.
-
Normal density function has left and right boundary regions. Data points on the left of the left boundary closing point, and data points on the right of the right boundary opening point are assigned as outliers.
-
Exponential density function has one boundary region. Data points on the right of the right boundary opening point are assigned as outliers.
-
Beta density function has one boundary region. Data points on the left of the left boundary closing point are assigned as outliers.
-
Gaussian KDE density function can have one or more boundary regions, depending on the number of peaks and dips within the density function. Data points in these boundary regions are assigned as outliers. In cases of boundary regions to the left or right, guidelines from Normal density function apply. As the shape for Gaussian KDE density function can differ from dataset to dataset, you do not consistently observe left and right boundary regions.
Syntax
| fit MultivariateOutlierDetection <field1> <field2> ... <fieldN> [by "<field1>[,<field2>,....<field5>]"] [into <model name>] [dist=<str>] [show_density=true|false] [sample=true|false][full_sample=true|false][threshold=<float>|lower_threshold=<float>|upper_threshold=<float>] [metric=<str>] [random_state=<int>] [partial_fit=<true|false>]
You can apply the saved model to new data with the apply command. You can inspect the model learned by MultivariateOutlierDetection with the summary command.
Syntax constraints
The constraints described in the DensityFunction algorithm all apply to MultivariateOutlierDetection.
Examples
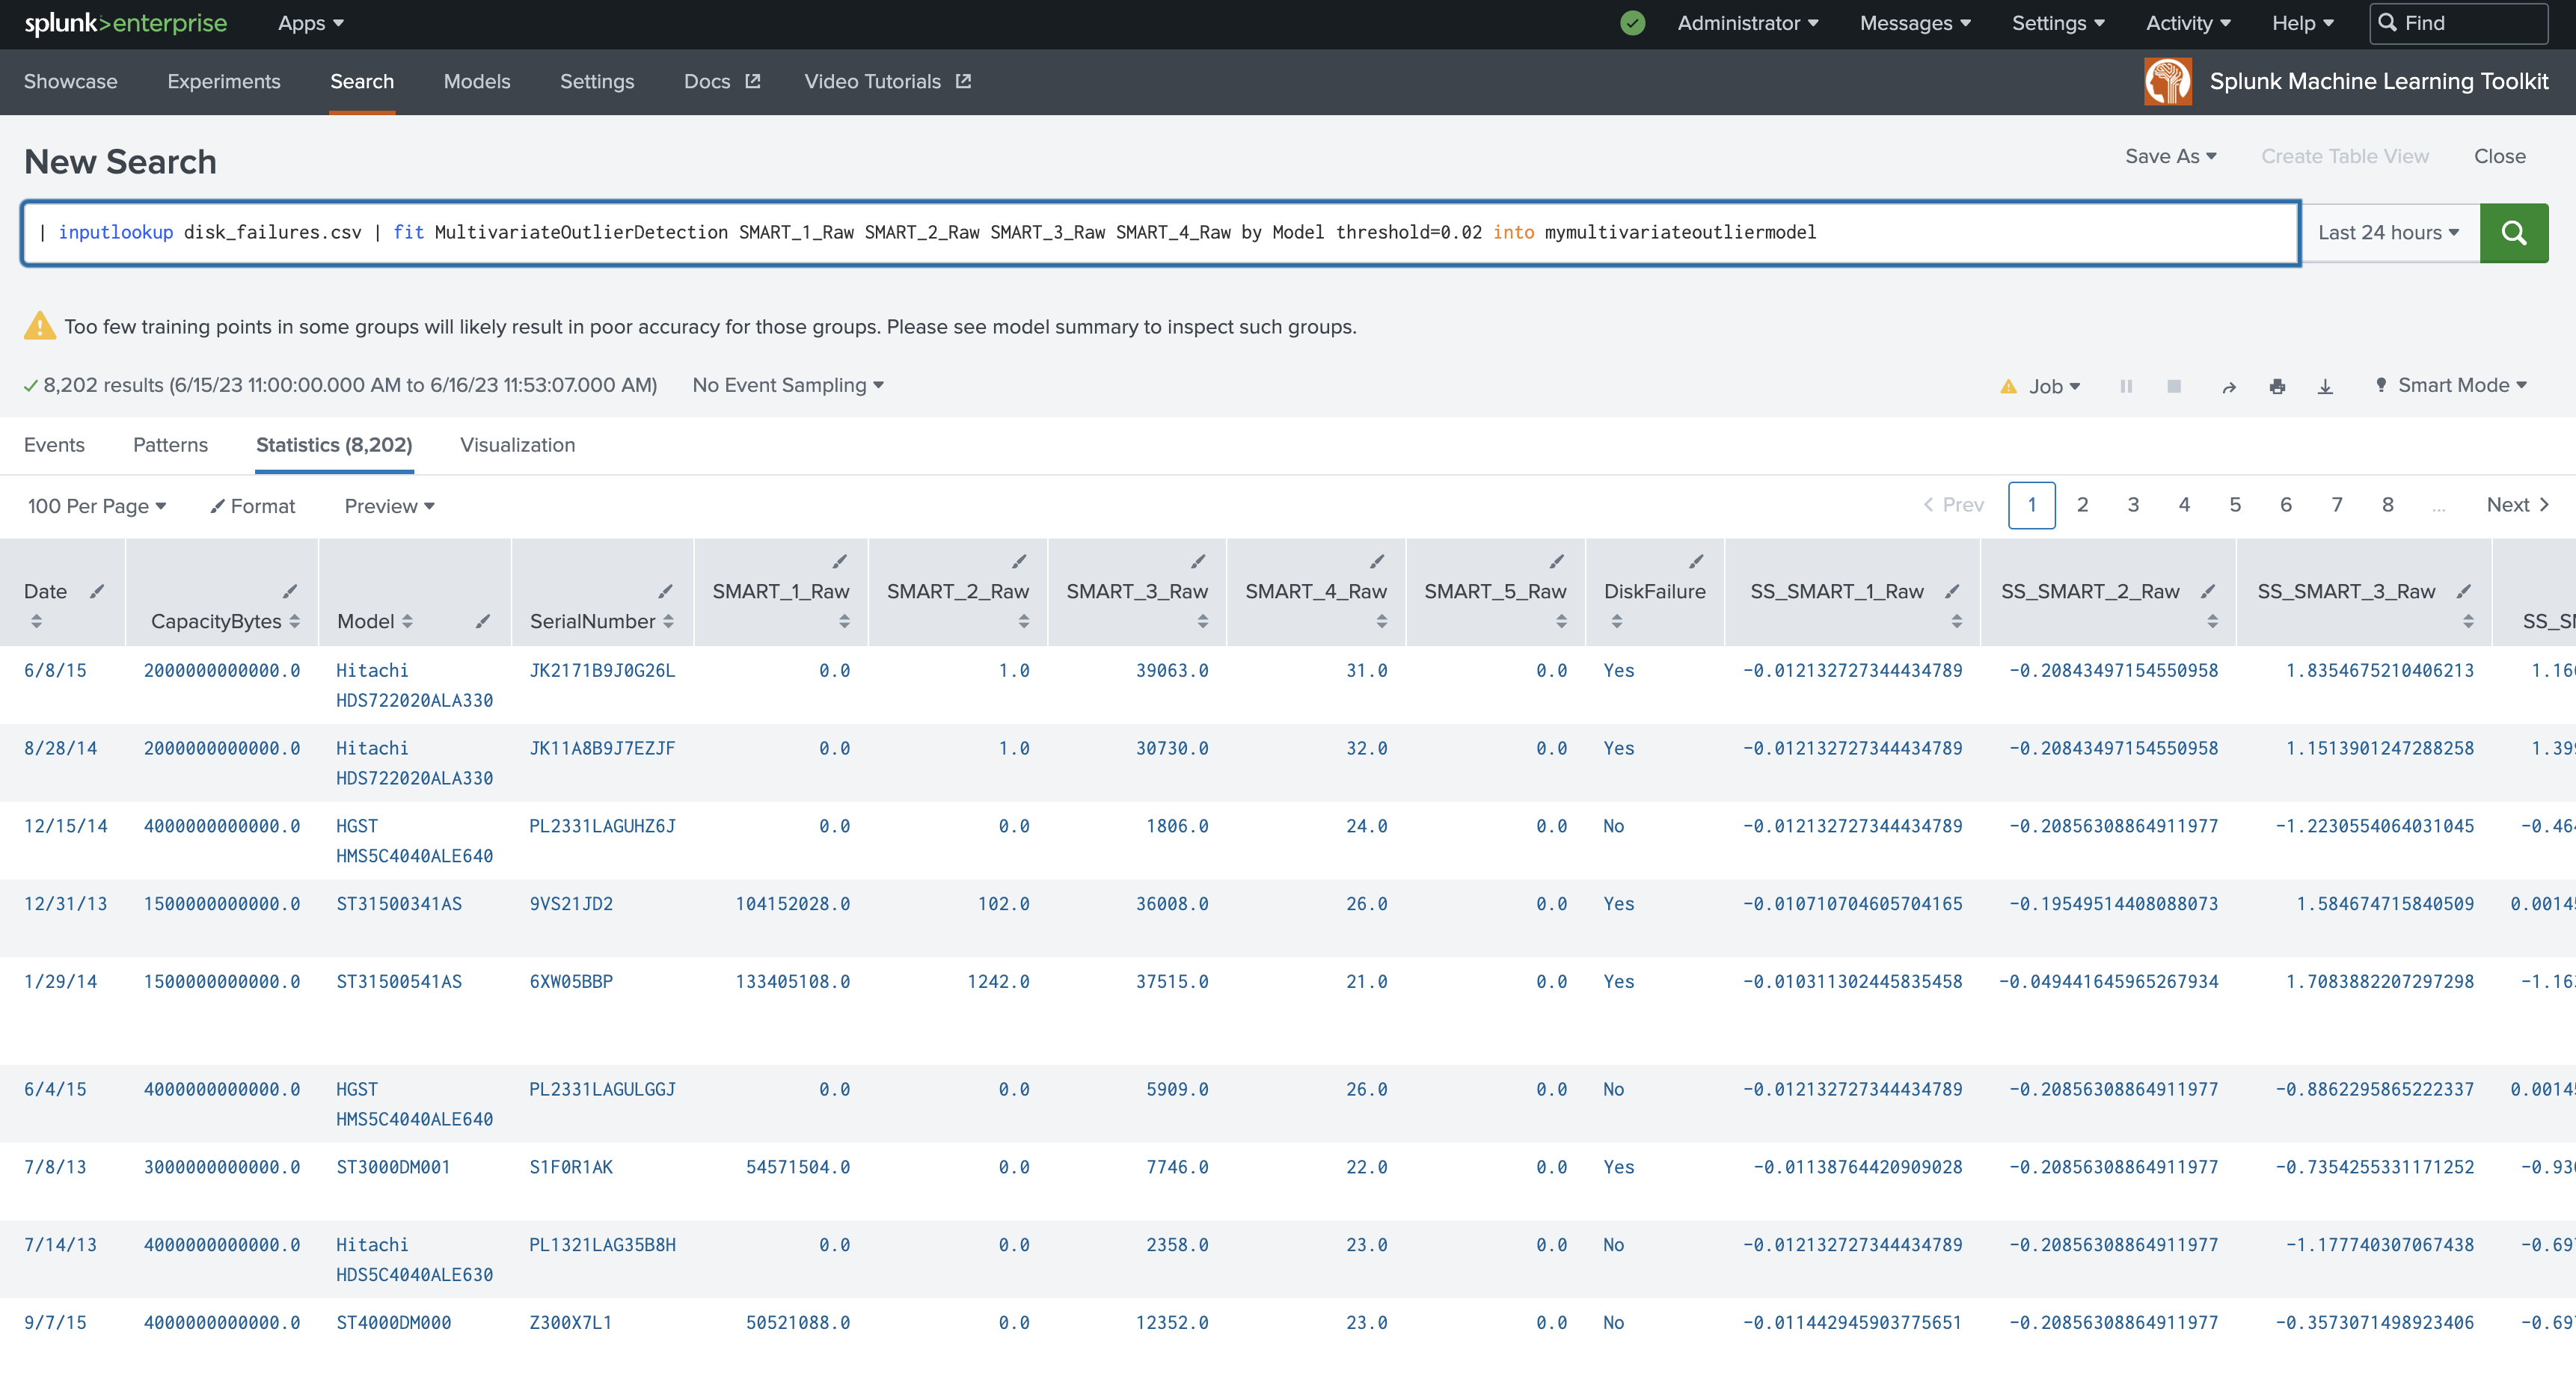
The following example shows MultivariateOutlierDetection on a dataset with the fit command.
| inputlookup disk_failures.csv | fit MultivariateOutlierDetection SMART_1_Raw SMART_2_Raw SMART_3_Raw SMART_4_Raw by Model threshold=0.02 into mymultivariateoutliermodel
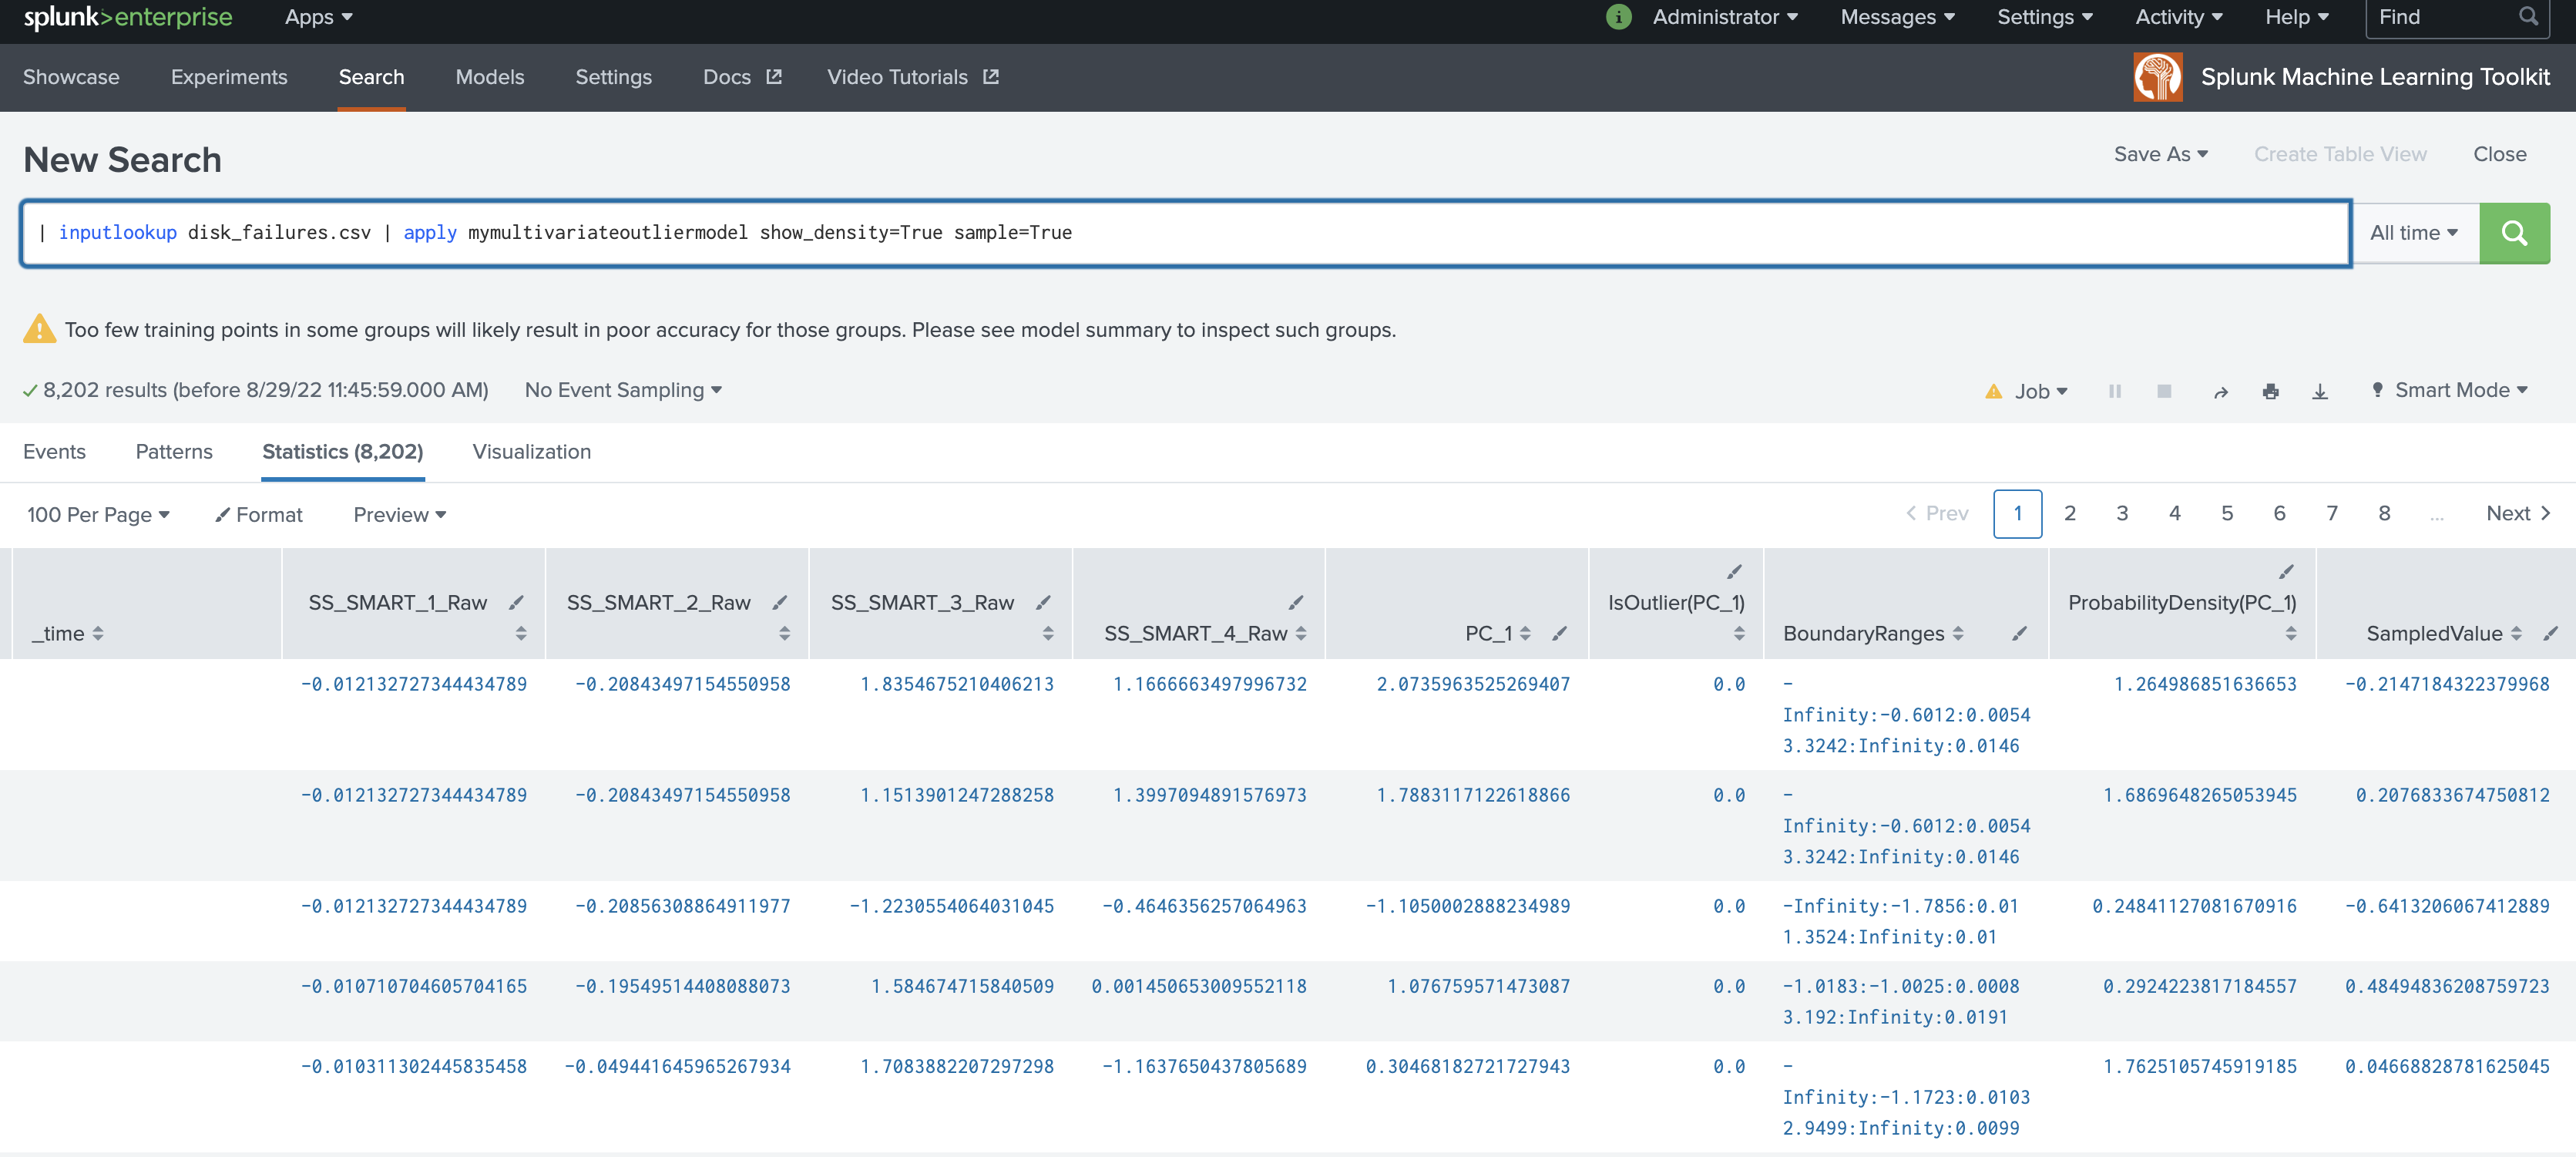
The following example shows MultivariateOutlierDetection on a dataset with the apply command.
| inputlookup disk_failures.csv | apply mymultivariateoutliermodel show_density=True sample=True
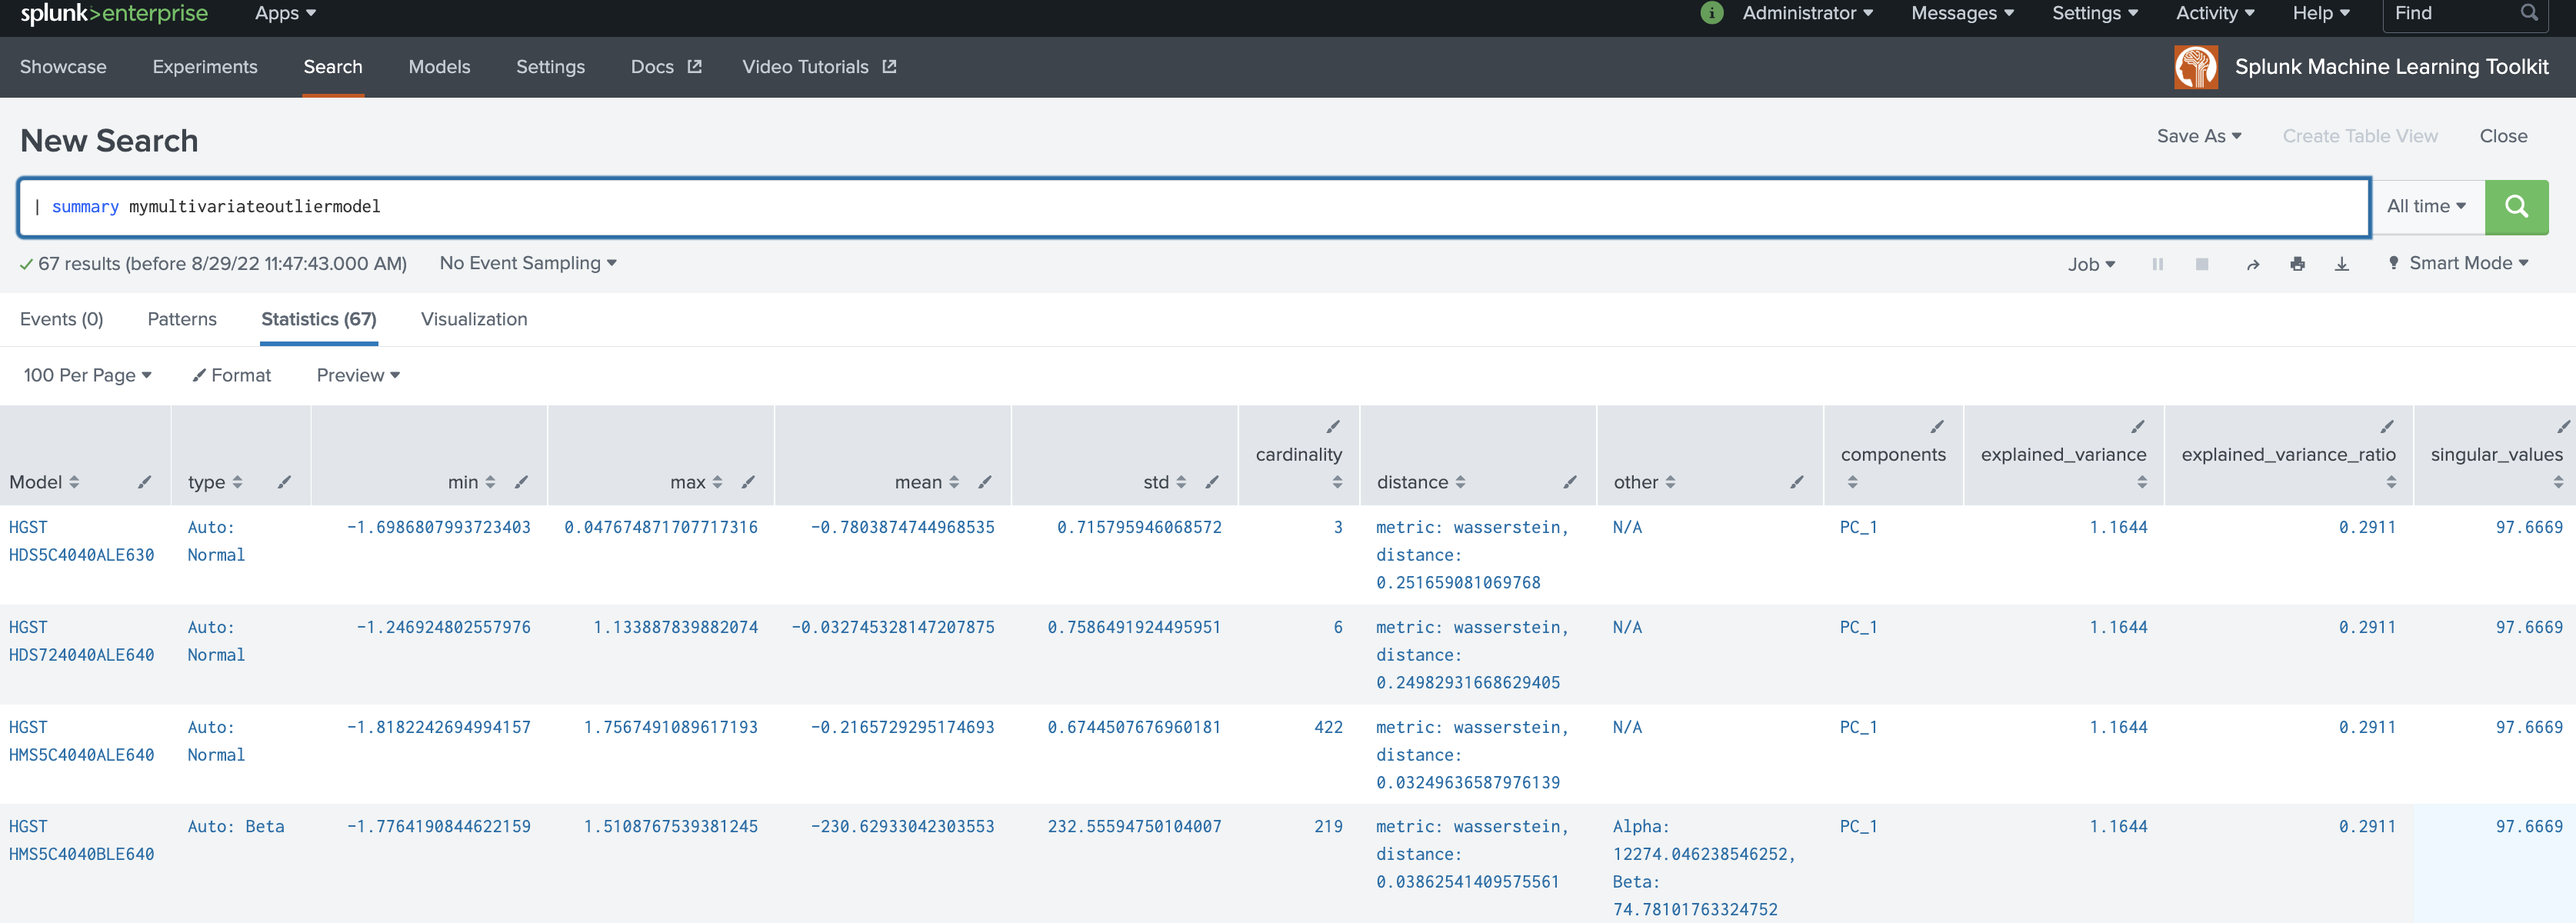
The following example shows MultivariateOutlierDetection on a dataset with the summary command.
| summary mymultivariateoutliermodel
Local availability Permalink to this section
- Local class:
MultivariateOutlierDetection - Source file:
Splunk_ML_Toolkit/bin/algos/MultivariateOutlierDetection.py(in-repo pathSplunk_ML_Toolkit/bin/algos/MultivariateOutlierDetection.py) - algos.conf stanza:
[MultivariateOutlierDetection] - Class bases:
BaseAlgo
Source Permalink to this section
Adapted from the Splunk AI Toolkit 5.7.3 documentation at /en/splunk-cloud-platform/apply-machine-learning/use-ai-toolkit/5.7.3/algorithms-and-scoring-metrics-in-the-ai-toolkit/algorithms-in-the-ai-toolkit (section: anomaly).